What the example shows
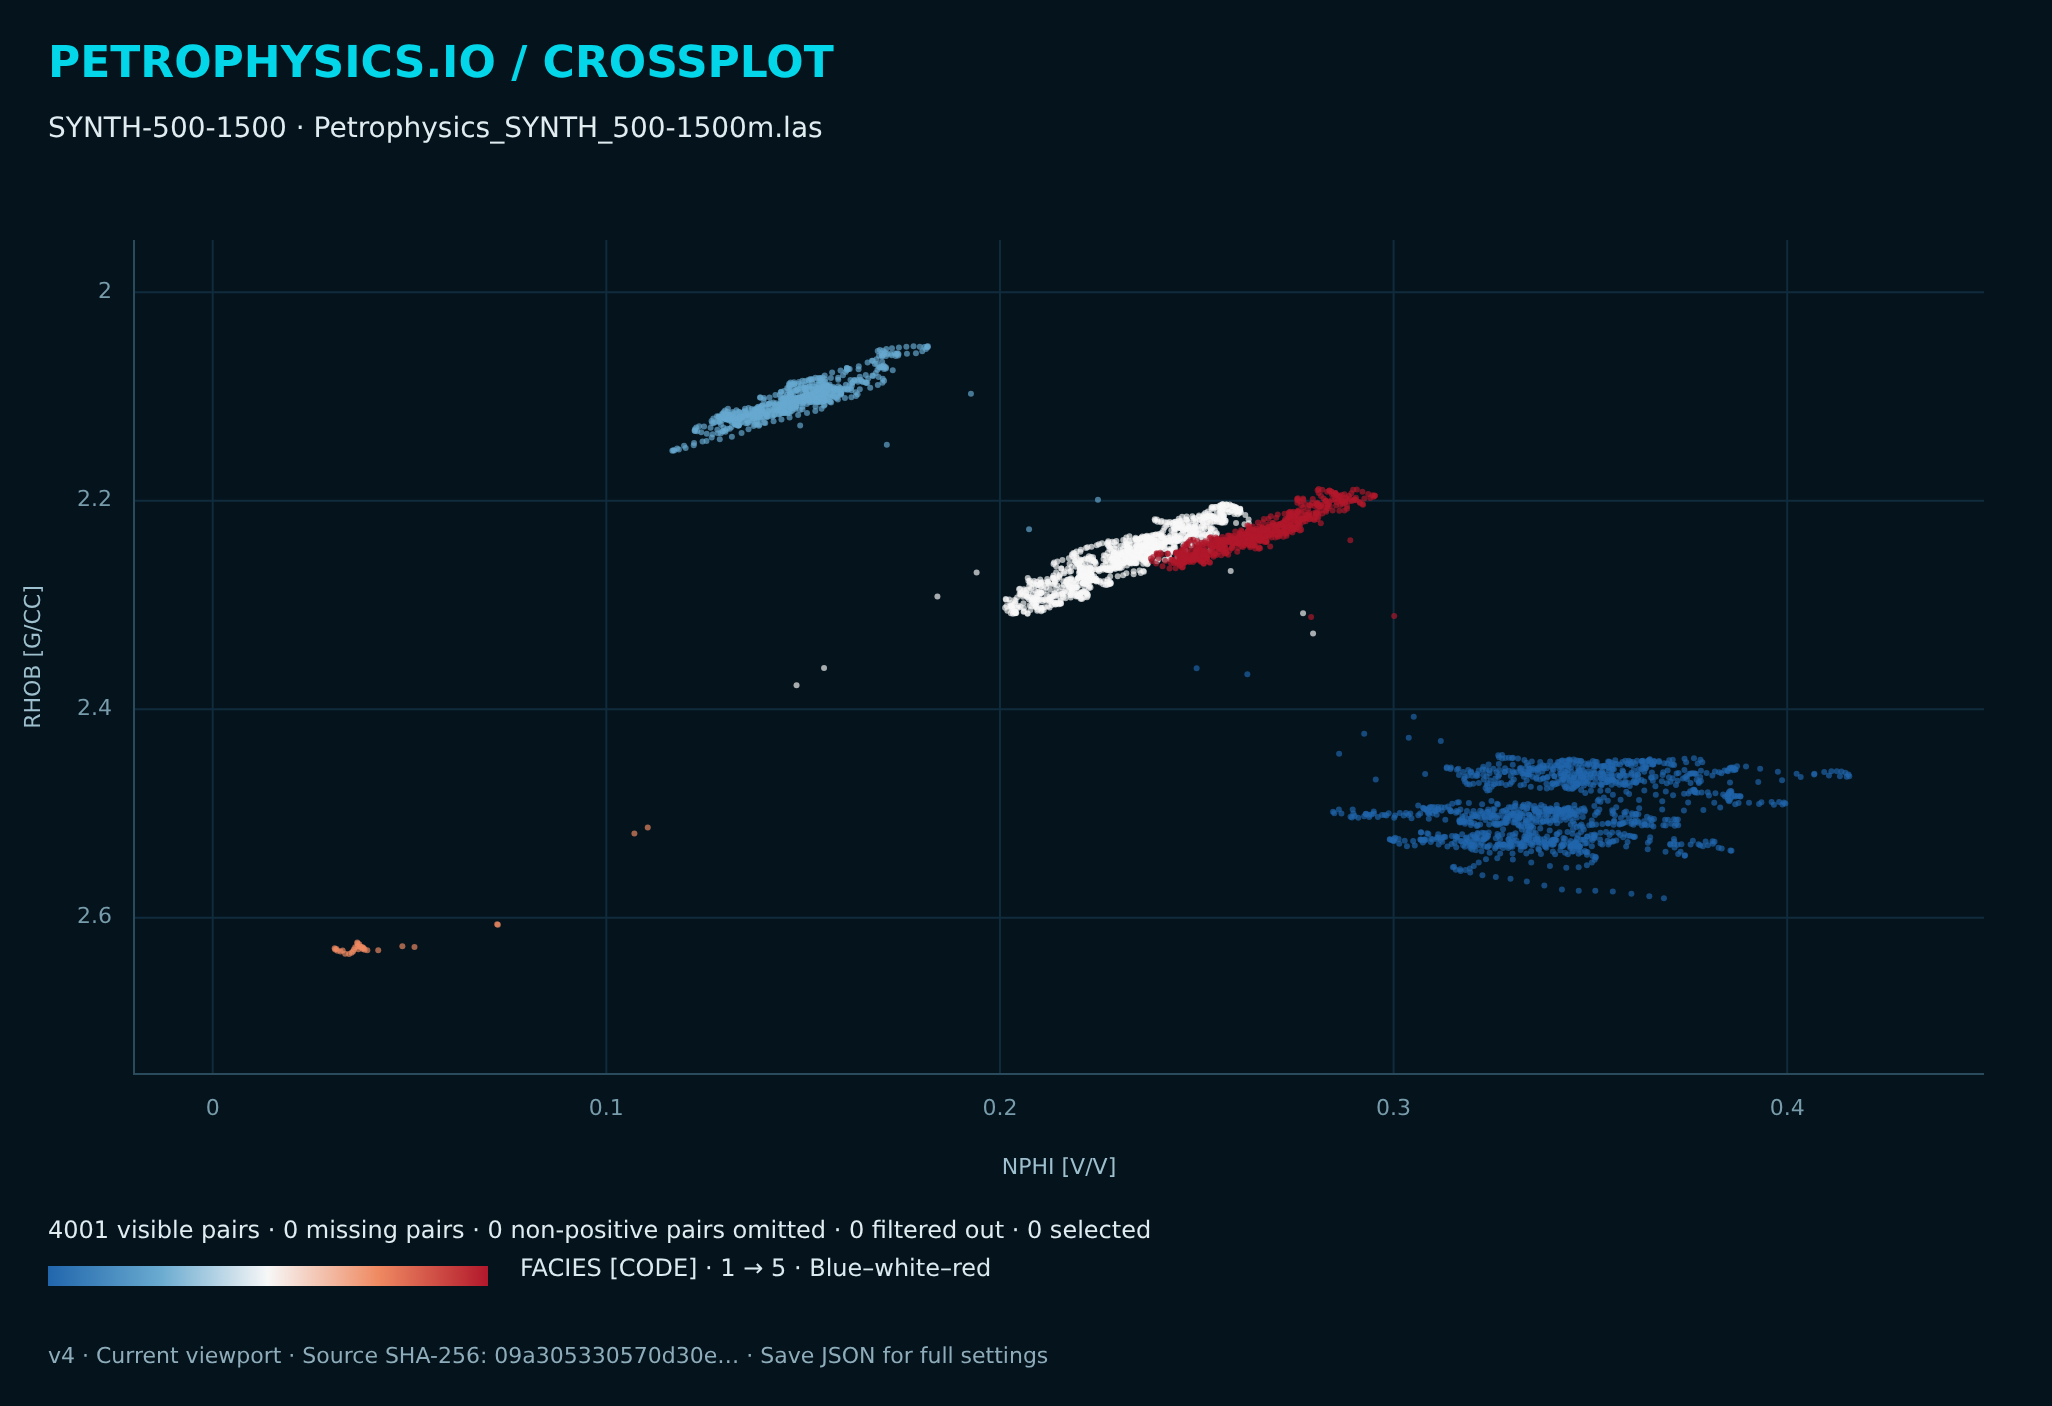
In our fictional gas sandstone, low fluid density reduces RHOB and low hydrogen index reduces NPHI. Shale has a stronger neutron response from bound water. The oil and water zones can overlap in the porosity crossplot; the assigned FACIES curve colours the known model classes. These colours are labels supplied with the synthetic data, not an interpretation performed by the tool.
Use compatible scales
The overlay uses RHOB from 1.9 to 2.9 g/cm³ left to right, and sandstone NPHI from 0.45 to −0.15 v/v. These conventional sandstone-compatible scales are intended for a quartz/fresh-water reference. Our model uses brine, shale and tool-response adjustments, so exact coincidence is not expected in every interval.
The crossplot uses X=NPHI from −0.02 to 0.45 and Y=RHOB from 2.75 at the bottom to 1.95 at the top. A gas-related shift can then be explored without confusing the crossplot axis direction with the log-overlay direction.
What separation does not prove
A crossover alone does not establish gas. Check lithology, neutron matrix calibration, borehole condition, invasion and other measurements. In this example, GR and resistivity support the specified model. The tight water-filled layer at 960–968 m has high resistivity because its porosity is low.
Read the underlying references
- SLB: Measuring Porosity Downhole — general density/neutron responses.
- SLB Energy Glossary: sandstone-compatible scale — the conventional overlay reference.
The plots here are original synthetic examples. No proprietary chartbook image or calibrated vendor interpretation grid is reproduced.
Download the data, model and settings · Check units and calibration